Monologue
This week's note marks an auspicious occasion. No, it's not the Supreme Court striking down the majority of President Trump's tariff regime, although, of course, our Macro and Market Monitors provide plenty of context to help navigate the fallout from the historic ruling.
We bring better news.
For the first time since arcMacro launched in October, our factor-based macro tracking framework has changed its assessment of the economic regime defining the US economy.
With sufficient data now in to update our models to January 2025, we have officially exited the long "Sluggish" regime that persisted for 29 months from June 2023 to November 2025, and entered a new "Goldilocks" era.
A "Goldilocks" regime is exactly what the name implies — not too hot, not too cold. It's defined by real economic activity roughly in line with its long-run potential, supported by easy financial conditions, and stable (not spiking) inflation.
"Sluggish" regimes of the type we're leaving behind are characterized by slow economic growth, despite the presence of significant support from easy credit conditions and low or falling inflation.
Accordingly, we attribute the transition from "Sluggish" to "Goldilocks" regime to recent improvements in activity indicators, notably the meaningful uptick in capacity utilization and corresponding rise in production, alongside rapidly improving survey-based outlook indicators (see Appendix for details). The stabilization of the labor market in recent months has also contributed to this shift, with growth in construction employment an important cyclical signal.
Call it a soft landing. Usually, the misalignment between real and financial factors means that "Sluggish" regimes are short-lived transitional phases leading into or out of deeper downswings (6-12 months). This time, a constellation of cross-cutting forces held the economy in an uncomfortable and unstable equilibrium for more than two years, and has now finally resolved in a positive rather than negative direction.
The transition marks the end of the COVID-19 economic story. The lingering imbalances triggered by the pandemic have now faded completely. The COVID-19 era began with a short and remarkably sharp "Crisis" and "Recovery" regime sequence, followed by a major "Overheating" regime that sent inflation soaring and forced the Fed to raise rates. This in turn created the conditions for the long "Sluggish" regime that followed, during which inflation gradually fell back to target, and the labor market cooled to its current state, which is, by historical standards, still on the tighter side of "normal."
That this process was achieved without an official recession or "Crisis" regime owes a lot to Biden-era industrial stimulus (and now a large Trump stimulus, albeit through different channels), the Fed slashing interest rates just in time to keep firms and households spending, and the AI bubble, which created direct growth-enhancing investment and a soaring stock market which kept wealthier Americans in the mood to spend. On the flip side, the "Sluggish" phase was almost certainly prolonged by unnecessary tariffs and elevated uncertainty in 2025.
So what should we expect from Goldilocks? It's been a long time since she's visited, but "Goldilocks" is actually the most common regime, accounting for nearly 30% of the time between 1975 and 2024.
The most recent Goldilocks regime ended in 2018. There was also one between September 2013 and December 2014, with the two punctuated by a "Financially Constrained" regime, when instability in Europe, a downturn in China's economy, and an oil price collapse tightened financial conditions sharply.
The 1990s tech boom was accompanied by a sustained 50-month "Goldilocks" setup from 1993 to 1997. Indeed, "Goldilocks" regimes last, on average, the longest of the seven arcMacro regimes, averaging 32 months.
In prior "Goldilocks" regimes, GDP growth has averaged 3.2% – in line with most estimates of the US economy's long-run potential – while CPI inflation has been stable but slightly above target at 2.5%. This almost exactly mirrors the current environment.
Public markets tend to perform well during "Goldilocks" regimes. They provide a strong setup for earnings growth, resulting in annual returns on the S&P 500 averaging 14.5% with the lowest standard deviation of any regime (10.8 percentage points). This time, with starting valuations elevated, we'd probably be looking toward the lower end of that range.
Goldilocks helps private markets "give back." Across historical Goldilocks regimes, the most notable feature from a private markets perspective is the strong distribution profile during "Goldilocks" periods. This is perfectly timed for the current private equity environment, with GPs seeking greater liquidity in order to meet LP demand for distributions.
If this regime holds for as long as Goldilocks setups usually do, we would expect distributions to rise to above-average levels in 2027 and 2028.
If you understand private equity's "big problem" as being the gap between the current market value and the book value of the companies acquired at elevated valuations during the 2018-2022 boom, then "Goldilocks" is just the regime you need to generate the operational improvements to close the gap and unlock exits.
The final question is "what comes next?" Historically, "Goldilocks" regimes lead to one of two diverging outcomes. Inevitably, after a sustained period of easy financial conditions and strong growth, inflation starts to tick up. The positive pattern is when the Federal Reserve spots this in time and tightens financial conditions (or markets will do this themselves via rising spreads and stock market corrections), leading to a "Financially Constrained" regime that cools conditions enough to avoid problems.
In the negative scenario, the Fed gets behind the curve, and a full-blown inflationary "Overheating" regime ensues, usually followed by some kind of crash when the Fed eventually takes away the punchbowl.
How long we're in a "Goldilocks" regime, and where we transition next, turns on inflation and how the Fed deals with it. As we discuss in the Macro Monitor, we now assess only a 15% probability of more than -25 basis points of easing from the Warsh Fed this year, and assign equal odds to the Fed implementing a hike by year-end.
If the inflation risks we're worried about do materialize, but the Fed under Kevin Warsh acts too late, we'll be on the road to overheating. However, if inflation can be kept below 3%, a longer Goldilocks regime is achievable.
For now, it's time to position for a cyclical sweet spot.
– Dylan Smith
Founder and Chief Economist
Marginal Movers and Must-Reads
Rising 👆
- Taxes: How governments are increasingly soaking the rich — A brilliantly provocative read on the state of taxation from The Economist.
- Productivity (a bit?): How AI is affecting productivity and jobs in Europe — "The authors find that AI adoption increases labour productivity levels by 4% on average in the EU, with no evidence of reduced employment in the short run."
Falling 👇
- Tariffs — The Yale Budget Lab has the rundown on the effect of the Supreme Court's decision (mostly reversed if President Trump's alternative 15% tariff is enacted)
- Business inflation expectations: According to some — see this week's Macro Residuals blog post for a counterpoint.
Macro Monitor
The trade civil war
On Friday, the US Supreme Court announced that the majority of President Trump's tariff regime is unlawful. The ruling applies to the sweeping "Liberation Day" tariffs, as well as separate tariffs on Mexican and Canadian goods not covered by the USMCA (NAFTA replacement) treaty, all of which were implemented under the International Emergency Economic Powers Act (IEEPA).
President Trump immediately announced a new blanket global 10% tariff under Section 232 of the U.S. Trade Expansion Act of 1962, which grants the President the power to impose tariffs on imports threatening "national security." He boosted that rate to 15% on Saturday. This is the same law governing existing steel and aluminum tariffs.
The long and the short of it is that tariffs are not going away, but the administration has become a bit more constrained in its ability to arbitrarily impose or threaten to impose very large tariffs.
In our view, the decision raises the odds of friction with Canada and Mexico around the mid-year USMCA trade agreement review, although we view the pro-USMCA stance of key swing states ahead of the November mid-term elections as a constraint on Trump's ability to alter the agreement substantially.
-
What's changed: The White House can no longer unilaterally control US tariff policy under the IEEPA without explicit Congressional approval. The Supreme Court ruled 6-3 that Trump's lawyers did not demonstrate that his administration had been delegated this power by Congress. Around half the effective tariffs on China, along with product-specific tariffs on industrial metals such as steel and aluminum, were implemented under different authorities and remain in place.
-
How does the new blanket tariff policy change things? For some individual countries, quite a lot. Brazil's 40% tariff rate, for instance, will fall to 15%. For the US overall, not much; the new tariff essentially replaces the old regime from a weighted average effective tariff rate perspective.
-
Will the new tariffs stand? The new tariffs will likely trigger an immediate legal challenge, and their similarity to the IEEPA tariffs that have been struck down will give that challenge a firm foundation to progress through the court system. However, legal battles take time, and their outcomes are uncertain, so immediate relief is unlikely.
-
What's the deal with rebates? More court battles. Democrats and business lobbies called for immediate refunds for importers. Funds collected from IEEPA tariffs are estimated at $135-175 billion, so repayment would represent a substantial fiscal stimulus — equivalent to more than 1% of annual GDP. In his press conference responding to the Supreme Court's decision, President Trump indicated that he had no intention of paying rebates, saying that there would be "years of litigation" ahead. It's entirely feasible that the next White House Administration will deliver an IEEPA rebate fiscal stimulus in 2029.
-
How does this all affect the economic outlook? Not much. If Trump's new blanket 15% tariff stands (alongside tariffs on China and industrial metals outside IEEPA), the net impact on the economic outlook will be minimal. The average effective tariff rate stood at around 11% before the ruling, and will not change materially under the new regime. The court's ruling and Trump's response have done nothing to reduce the trade-related uncertainty that is weighing on business investment.
Shutdown shuts down GDP momentum
The "advance" (read: likely to be revised) estimate of US Q4 GDP growth poured some cold water on the recent run of optimistically above-forecast data. Headline growth came in at +1.4% in annualized quarter-over-quarter terms, way below the consensus expectation of +3.0%. That leaves growth for 2025 as a whole at 2.2%, down from 2.8% in 2024 — not too bad considering the -0.6% annualized decline in the first quarter of the year.
The disappointment will prove to be more fleeting than permanent. Federal government non-defense spending collapsed (down a whopping -24% on an annualized basis), indicating that the shutdown impacted the aggregate data more than we anticipated. This trend will likely reverse in Q1, artificially boosting the growth rate. And, since the period after the shutdown ended was the most under-sampled in the report, we may see substantial upward revisions to the Q4 growth rate.
One trend that has only picked up steam in the GDP data is the AI-related investment boom. We like to track the "demand" side of this trend – i.e., firms paying for new software and R&D – which is now contributing more to GDP growth than it did during the dotcom boom (see chart).
G7 Inflation stubbornly above target
December US personal consumption expenditures (PCE) inflation data published alongside the GDP report delivered a big upside surprise, complicating the softening picture coming from the rival Consumer Price Index (CPI). In year-over-year terms, PCE inflation stood at 2.9% in December, compared to 2.7% for CPI (which fell to 2.4% in January).
The main difference between the indices is the weight on shelter costs, which is lower in PCE (~16% vs 36% in CPI). Given that this component of CPI suffers from significant lag problems, we'd favor PCE as providing a more accurate "real-time" read of inflation at present.
Another reason to put more weight on PCE than CPI: it's the Fed's official target measure of inflation. And the Fed is not alone in dealing with a target inflation trend that refuses to fall to the 2% level that most banks target. Its peers have the same issue.
FED outlook becomes murkier
This would not come as a surprise if you read our post-meeting commentary, but FOMC minutes released this week showed that Fed officials are, on balance, cautious about making any further rate cuts in the near future, having correctly identified signs of stabilization in the labor market.
This week's data and developments made the picture even murkier. We're already dealing with uncertainty over incoming Chair Kevin Warsh's views. Add to that the mixed signals on inflation (high December PCE, tariff uncertainty) and the clear underlying growth momentum in the economy, and the 6-12-month path for rates is becoming very difficult to predict.
One possibility is that Warsh will offer a 25-basis-point "appeasement cut" in his first meeting in July, and take it from there based on the data. Understanding this, markets have been shifting the balance of probability to one (and only one) cut in the first half of this year.
We now see a second 25-basis-point cut this year as low probability (15%) and would assign equal weight to the possibility of a hike by year-end.
See the appendix for arcMacro proprietary Factors and the Key Macroeconomic Indicators tracking chart.
Market Monitor
Public markets
Friday's chaotic news flow – poor GDP numbers (with caveats), hotter-than-expected PCE inflation, tariffs struck down then reimposed under new laws – made for a difficult trading day and upended some of the week's major market themes.
Until Friday, global geopolitics was back in the driving seat after two weeks in which markets were dominated by (somewhat contradictory) rising skepticism about the pace of the AI infrastructure build-out and the impact of AI tools on software service provider business models.
Oil prices rose to the highest level since August as tensions around US/Iran talks ratcheted up, before finishing the week only +$3.66 per barrel higher at $66.3 (for WTI crude) after dovish overtures from both sides of the negotiations.
Meanwhile, the dollar gained +1% against major trading partners this week, and gold rose back above the $5000 per ounce mark.
Stronger economic data pushed up the US yield curve, with yields on 2-year Treasury Notes up +8 basis points to 3.48%.
The main repositioning on Friday reflected updated assessments of the sector- and industry-level tariff impacts, but excitement over potential margin improvements for tariff-affected companies such as Apple had mostly worn off by the end of the day, leaving the week's moves relatively small. The main upshot was a minor recovery in IT and Communication stocks that were hit hard by the recent selloff.
In the end, the S&P 500 closed +1.1% higher on the week, the Nasdaq rose +1.5%, and the Dow Jones Industrial Average and Russell 2000 small-cap index were essentially flat, reflecting the market's view that tariff policy changes are not a win for ordinary non-tech, non-financial businesses.
Gold prospecting
Purely to annoy goldbugs, we like to point out that the gold price has detached itself from the market risk cycle in 2026 — some soft evidence that gold is on a speculative rather than fundamentals-driven ride at present.
Private Markets
McKinsey's annual Global Private Equity Report is out. It's come a long way since our humble Chief Economist made contributions to it, and it's well worth a read (especially if you like automotive metaphors).
Here is the chart we found most interesting:

See the appendix for the market monitor table.
Memo
How to invest in Goldilocks
Bottom line: The economy is entering a period characterized by healthy growth, easy financial conditions, and (for now) stable inflation.
What it means for investors: Position for growth re-ratings in equities, an eventual (mild) yield curve flattening, and an acceleration of the nascent turnaround in the private equity cycle.
The arcMacro factor-based macro framework has signaled a shift in the US economy from a "Sluggish" regime of sub-potential growth, softening labor markets, and falling inflation, to a "Goldilocks" regime of higher growth, stable inflation, and easy financial conditions.
In this note, we offer some suggestions for how investors might think about repositioning portfolios to take advantage of the improving macro setup.
- "Goldilocks" regimes are periods of "not too hot, not too cold" economic conditions that tend to last relatively long and are not associated with major imbalances. The similarity between current conditions and the "Goldilocks" regime that was in place during the 1990s tech boom is notable.
- Goldilocks is good for stocks, bringing S&P 500 returns roughly in line with the historical average, with fairly low volatility. That said, "Goldilocks" regimes don't always start with the elevated valuation environment we're currently in, so this "Goldilocks" regime may be on the lower end of the typical 10%-25% range.
-
Interest rate dynamics during "Goldilocks" regimes are fascinating. In all prior "Goldilocks" regimes, the yield curve has flattened. In the majority of cases, this has been a "bear flattening," where short rates rise more than long rates as policymakers gradually increase interest rates to keep up with the stronger economy.
In most cases (the exception being the post-GFC "zero lower bound" period), the 10y3m yield curve has become completely flat or inverted during the "Goldilocks" regime, before lifting off again.
There are two reasons to believe this time might be an exception to the "bear flattener" rule. First, long-run rates are anchored high on fiscal concerns, and could easily rise on hot inflation, growth, or fiscal data. Second, the Fed is currently exhibiting a dovish bias and looks unwilling to act preemptively to raise rates as the economy heats up. We can see a mild flattening over the longer 1-2 year period ahead.
- Turning to the private markets, Goldilocks brings extremely good news. Since reliable data on private equity has been available, "Goldilocks" regimes have reliably coincided with a rise in distributions (funds returning cash to investors). This is exactly what the industry needs to support the emerging turn in the private equity cycle. Note that overall deal-making and fundraising tend to sit at neutral trend levels during Goldilocks phases.
-
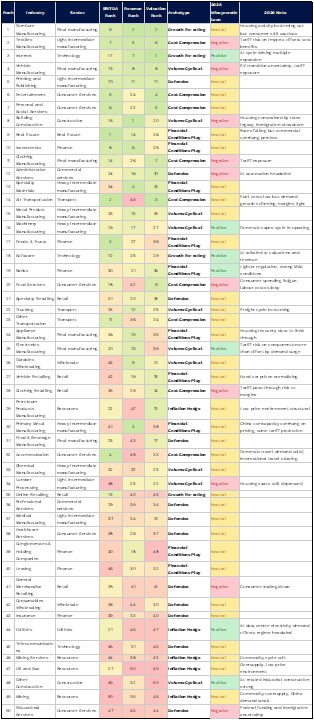
"Goldilocks" regimes affect different industries differently. We've summarized the sector-level dynamics at play using our [cyclical macro beta tool], ranking industries by the sensitivity of their growth, earnings, and valuations to real, inflationary, and financial dynamics that define "Goldilocks" regimes. We've also included a judgmental view on where dynamics in the 2026 "Goldilocks" period may differ.
The Appendix defines the "archetypes" column and provides an industry-level version of this table with all 50 arcMacro industries for your perusal.
The takeaway: for both public and private equity investors, rotate back into sectors with positive leverage to improvements in demand and easy financial conditions.
Conclusion
Based on prior "Goldilocks" periods, investors should position for a period of reasonably strong returns driven by underlying growth momentum and accommodative financial conditions.
There are important risks that might make Goldilocks' latest visit shorter than usual. Inflation risks are tilted firmly to the upside, implying a potential transition into an "Overheating" regime on the horizon. With this in mind, we would pay more attention to inflation resilience than usual during "Goldilocks" regimes.
On the downside, loss of confidence in the promise of AI could trigger a market crash that reduces consumption enough to send the economy back into a "Sluggish" or even "Crisis" regime. We don't see any immediate triggers for such an event in the short term, but the longer financial conditions stay easy, the greater this risk becomes.
Appendix
Proprietary Factor and Regime Model and Key Macro Indicators

Goldilocks Regime Analysis
Archetype definitions
- Financial Conditions Play — Performance is primarily driven by access to credit and multiple expansion. These industries thrive when borrowing is cheap and risk appetite is high, regardless of the inflation or growth backdrop.
- Cost Compression — Benefits from low inflation through margin expansion, but volume growth is limited. Top-line is modest; the story is input cost relief rather than demand strength.
- Volume Cyclical — Revenue is the dominant driver. Activity levels respond strongly to real growth and financial conditions, but margins and valuations don't follow proportionally.
- Inflation Hedge — Revenues and margins are tied to nominal price levels. These industries are structurally disadvantaged in low-inflation environments and tend to rank poorly in Goldilocks.
- Defensive — Low sensitivity across all three metrics in either direction. Performance is relatively regime-independent, driven more by idiosyncratic factors than the macro cycle.
- Growth Re-rating — Valuation is the dominant channel. Easy financial conditions drive multiple expansion more than near-term earnings, typical of long-duration growth assets.
- Operational Leverage — High fixed cost structures mean small changes in volume or pricing flow disproportionately to margins. Can rank well on margins but inconsistently across revenue and valuation.