Monologue
There is a lot going under the radar as Iran dominates the news flow. We've dedicated a lot of space this week to interesting data developments in the Macro Monitor and offered some throughts on developments in private credit in the Market Monitor. Most important is the long and timely Memo dissecting the 2026 software selloff and identifying where we see opportunities. If you read one thing this week, make it that.
Of course, we can't get to any of that without updating our guidance on Iran.
The name of this section ("Monologue") might connote a certain level of hubris, but I want to start with a spoonful of humility. I was one of the people playing down the economic impact of the war in its first few days. My view has evolved over time, and I now see the war as a potential (note: still potential) economic shock larger than the Russian invasion of Ukraine in 2022.
What did I get wrong initially? Not the economics per se — in fact, if the Gulf of Hormuz opened tomorrow, the net economic impact of the war would be essentially negligible.
No, my mistake was to underestimate the sheer lack of strategic clarity behind the American involvement in to the war. It seemed initially like the only rational way to engage Iran was similar to the January operation in Venezuela on a larger scale: a fast, focused campaign with a limited goal that's easy to demonstrate has been achieved. Venezuela was claimed as big success. It was certainly militarily impressive, but note that the same regime remains in place under a different leader.
Still, it appeared to embolden Trump to take action in Iran.
The context is very different, but it reminds me of David Cameron's success in seeing off the Scotland independence movement in the referendum in 2014 emboldening him to take a hugely misguided and mismanaged gamble on the bigger and more important Brexit referendum in 2016.
Last week I spent a lot of words basically saying that the entire Iran file hinges on Trump's ability or inability to back out of the war. That's still an open question, but the direction of travel is towards the answer being that he can't, and therefore towards a sustained rise in energy prices.
I'm not an expert in geopolitics, but who is? There is no accreditation body, and the guidance from genuine experts is still extremely vague and broad, with most being stuck outlining a set of potential outcomes ranging from a cessation of hostilities within weeks, to regime change, to a prolonged war, to a fractured Iran mired in years of proxy wars.
Anyway, here is how I see the geopolitical logic. Take it or leave it on merit. It's a simple syllogism that goes something like this:
- Premise: Iran, under a hard-liner Ayatollah, can strike ships, lay mines, and harry shipping in the Hormuz Strait with cheap drones and missiles essentially indefinitely.
- Premise: Israel is running the offensive strategy, both via direct strikes that pull in US support and by close alliance with and influence over the Pentagon.
- Premise: Both Iran and Israel have a high tolerance for economic disruption, since geo-strategic aims trump economic outcomes.
- Conclustion: The US therefore does not have a way to withdraw from the war without first escalating it, even though it wants to open the Strait of Hormuz as soon as possible.
This is now a war of military and economic attrition — which points to a longer engagement. America's only option for ending the conflict soon, alongside continuing military bombardment, will be to squeeze Iran's cashflow immediately. This weekend's strike on Iran's crude export facilities on Kharg Island attest to that strategy being in play.
So the new key question now is how long the escalation phase will last before Iran is forced to the negotiating table (and Israel is ready to negotiate). A related question is how much OPEC and North American production increases, alongside strategic reserve releases, can limit the price of crude. We don't have enough information to answer either question just yet.
It's difficult to see how the President can find a way to satisfy Israel that strategic aims have been achieved, claim a win on Iran (capacity destruction, ignore regime change), and – the hardest bit – find a way to prevent Iran from using its strategic leverage in Hormuz.
I would not be surprised to see him trimming down the strategic objectives of the war soon in public statements. Perhaps it will all have been about reducing Iran's military capacity or limiting their nuclear capabilities. I suspect we'll hear less about unconditional surrender or regime change from the White House going forward.
Meanwhile, the thinking on how the Iran war will affect the global economy has not changed. The effect of higher oil prices on inflation depends on how high they go (we're talking 3+ months before it's meaningful). Any major growth shock would come with a delay and be contingent on a very large ($125+ per barrel oil) and sustained price increase.
One last thing – my analysis of the effect of $100 oil on Canada was published by the Globe and Mail on Friday. You can read it here.
Dylan Smith
Founder and Chief Economist
Marginal Movers
Rising 👆
- American Inequality: Measuring poverty on a spectrum instead of an arbitrary line conveys a more accurate picture of inequality — "In the U.S., I’ve calculated that it takes 63 minutes on average to get $1 in income. That’s much slower than in many other high-income countries"
- The Legacy of Lloyd: Goldman executive says private markets clients ‘glad’ about Iran war ‘distraction’ — In the spirit of then-CEO Lloyd Blankfein's "doing God's work" quip in the wake of the Global Financial Crisis, it's good to see the old culture is still alive at Goldman.
Falling 👇
- The Revolution: Iranians rethink the price of regime change — "Approaching two weeks into the war, no signs exist of the sort of anti-regime unrest that broke out across the country in January"
- The "Canadian Model:" Ontario’s $250B+ pension plan faced a steep PE portfolio loss. It’s not alone. — The Maple 8 are marking down their private portfolios to reflect years of poor performance. Don't panic; this is old information. The cycle is bottoming out, and this revluation reflects a calibration of book values to 2+ years of poor market dynamics.
- Individual expression: Why AI writing is so generic, boring, and dangerous: Semantic ablation — Not a new article, but one that's worth coming back to every now and again to remind ourselves of the value of human expression. A very quick and worthwhile read.
Macro Monitor
The macro data flow is getting messy, with conflicting signals across releases and some surprising numbers that come with plenty of caveats. Our factor-based regime is still in "Goldilocks" mode, but it's looking marginal after the soft round of employment data last week and the downward Q4 GDP revision. We would have been confident in a reversal next month, but as the Iran impact starts to trickle in, we fear a reversal back to a "Sluggish" regime may occur. It's better to think of the economy as bring in a fragile transition between the two regimes at present.
Dead-on-arrival inflation data
There is an interesting wedge opening up between Personal Consumption Expenditure (PCE) Index (which is what the Federal Reserve targets) and Consumer Price Index (CPI) inflation. The CPI usually gets more attention because it's more timely than the PCE Index, and in normal times predicts PCE well.
Its major drawback is that it assigns a whopping ~25% weight to housing costs (~33% when stripping out volatile food and energy prices), while also measuring those housing costs with a significant lag. At present, that's artificially depressing CPI inflation by capturing rent declines that happened a year or more ago. It's also doing a worse job than PCE of capturing rising health insurance premiums.
Never has so much interesting inflation data been so dead on arrival, however. March will represent a structural shift in the inflation series. As of mid-March, we’re already seeing gas prices rise enough to contribute meaningfully to headline inflation (exactly how much depends on what oil prices do for the rest of the month). In Europe, the shock is transmitting via natural gas to electricity prices, too.
If sustained for six months, the current ~$30-40 per barrel rise in oil prices will take headline US inflation from 2.5% to 3.5-3.8%. Hence, bets that the Federal Reserve will cut rates are rapidly being taken off the table.
Revision Division
The growth rate of US Gross Domestic Product in Q4 was pegged down from 1.4% in the "advance" estimate to 0.7% on weaker than expected consumption and investment in the back end of the quarter, bringing annual growth to 2.1% in 2025.
This is a good time to remember that GDP is not a great barometer of economic activity. For a more accurate read, look to Gross Output (due with the next GDP revision in a month's time), or our arcMacro Real Factor, which extracts the common signal from a wider set of activity data, including GDP and its components (see appendix).
Good old JOLTS
The Job Openings and Labor Turnover Survey for January brought some much-needed good news on the US labor market front. Job openings rose to 6.95 million from 6.55 million, while layoffs fell and have decisively broken with the rising trend that defined 2025.
As the chart below shows, the hiring freeze that has helped the labor market adjust from its post-COVID-19 overheat has levelled out (we're in line with 2016 levels), and companies are still not in the mood to lay off their staff.
Canadian employment calamity(?)
StatsCan reported that employment declined by 84k in February, embarrassing the consensus forecast of a 10k gain, and causing the unemployment rate to rise from 6.5% to 6.7%. This was an unambiguously bad number, with the job losses coming from full-time positions across a broad range of private industries.
It's somewhat suspicious that this report lines up with the also surprisingly weak February US nonfarm payrolls report. Both were out of sync with the rest of the macro data flow. More evidence perhaps that weather and strange seasonal adjustment effects are probably a factor, and that we might get a reversal in March. Another clue is that half the job losses were in the 15-24 year age group, whose employment does tend to be more seasonal.
See the appendix for arcMacro proprietary Factors and the Key Macroeconomic Indicators tracking chart.
Market Monitor
Public markets
The WTI crude oil finished the week at $97.4 per barrel, after brushing $120 in intraday trading earlier in the week. The price remains extremely volatile as traders parse news on the likely length and severity of the ongoing war in Iran, alongside efforts to increase supply to replace lost shipments from the Strait of Hormuz.
Outside of oil markets, we're yet to see a true "risk off" trade emerging. The vibe is more that investors are trying to feel their way through a crisis that doesn't have a clear precedent to work from. Case in point: the price of gold fell by 1.6% this week, even as geopolitical disruptions and inflation risk have risen.
That may reflect higher US policy interest rate expectations, which have shifted the US yield curve up significantly. The 10-year benchmark is up to 4.28%, back to where it was trading in January and looking close to breaking up to the highest yield since the first half of 2025. What this tells us is that higher interest rates are swamping any "safety" flows into Treasuries.
It's also outweighing flows into other countries such as Switzerland, with the US dollar rising against all global currencies (the DXY index closing the week 1.6% stronger).
Stocks were down sharply on Thursday and Friday as the combination of higher oil prices and higher interest rates got priced into discounted cash flow models and the GDP revisions soured the mood. The S&P 500 fell by 1.6% on the week, although energy stocks were up by 2.1%.
Private Markets
Perhaps the only market theme breaking through the wall-to-wall Iran coverage is the growing concern over systemic risk in the private credit industry. The mood is getting increasingly jittery.
In a prior note, we've pointed out that the underlying problem is not the private lending model itself, but rather the incompatibility between illiquid fund structures and flighty retail investors.
Another issue complicating the private credit theme is the lack of publicly available data. In the past this has been in the interest of the private credit funds (able to control their narrative to investors), but it's now enabling the sense of panic around the industry to grow, perhaps unwarrantedly.
Apollo's push to mark the value of its private credit funds daily rather than monthly is an interesting response to that problem. The move is designed to improve transparency and liquidity.
The underlying issue, which is hard to get a good handle on, is how much the underlying collateral – mostly mid-market private equity sponsored companies – is deteriorating. Some investors (like JPMorgan) are marking down their private credit portfolios conservatively.
We can get a sense of what might be going on within funds by looking at data on the broadly syndicated loan market, which competes directly with private credit. There, we're seeing rising distress, measured by the share of performing loans trading below 80c on the dollar. Note that this is a reflection of market perceptions, not an absolute measure of credit quality.
The great puzzle of the private credit file, from our perspective at least, is that spreads simply are not moving in a way that would indicate a major rerating of underlying asset quality. This is something we'll come back to regularly.
See the appendix for the market monitor table
Memo
Fear over Fundamentals: Indiscriminate Software Selloff Creates Opportunities
Bottom line: Shares in listed software companies are down by ~10% globally year-to-date. We explore the entire universe of software companies across multiple dimensions for clues about how investors have changed their thinking on the industry. We come up empty. This was an indiscriminate, animal-spirited stampede out of software, sparked by vague fears of AI disruption. All we can say from our analysis is that the rout has radiated outward from the US and that, among the small subset of stocks with consistent Morningstar analyst coverage, companies with a strong network-effects moat fared slightly better.
What it means for investors: The lack of a clear investor hypothesis behind the flight from software creates opportunities. First, it suggests the entire revaluation lacked a basis in fundamentals, providing possible dip-buying opportunities. Second, it's a stock-picker's dream; companies that are assessed to benefit from AI rather than be harmed by it have more attractive entry points. Third, it underscores the advantage of private equity and venture investors, who have a better understanding of AI that informs investments, more influence over how it drives (or harms) performance in their companies, and can look through the volatility in public markets.
On February 3, 2026, Anthropic launched Claude for Legal, a plugin that helped clients adapt its Claude LLM for tasks such as legal drafting or document review. This was the first of a series of product extensions that put their Claude LLM to work in formerly specialized contexts including finance and professional services.
The reaction was a severe selloff in software stocks, based on the fear that previously specialist software solutions would be generalized under the umbrella of the foundation AI infrastructure providers like OpenAI, Anthropic, Google or xAI.
Nobody had a decoupling of software valuations from the broader tech industry on their 2026 bingo card, but here we are.
If you're worried about AI undermining the business model of a set of software companies, it stands to reason that some of those companies may be more or less at risk. Some companies perform tasks that are too complex to automate, or operate in high-precision or highly regulated context that don't tolerate AI-based errors — they should be safe. Perhaps larger companies, or those with a better moat, or those in certain sub-industries, have less AI risk. Maybe some will even benefit on net from deeper integration with core LLMs.
Armed with this assumption, we went to the data hoping to uncover a handful of software company "archetypes" that might give us some clues about how investors have re-assessed the prospects of the software industry. Our analysis covers the full universe of global listed stocks classified by PitchBook as being in the "Software" industry (we used PitchBook because they have a comprehensive sub-industry categorization). After trimming out companies without reliable price or financial data, we were left with 1,989 companies to work with.
We found very little signal in the noise. Instead, we got a series of null results that emphasized the seemingly indiscriminate nature of the selloff.
So, join our exploration, and see if you can spot anything we might have missed.
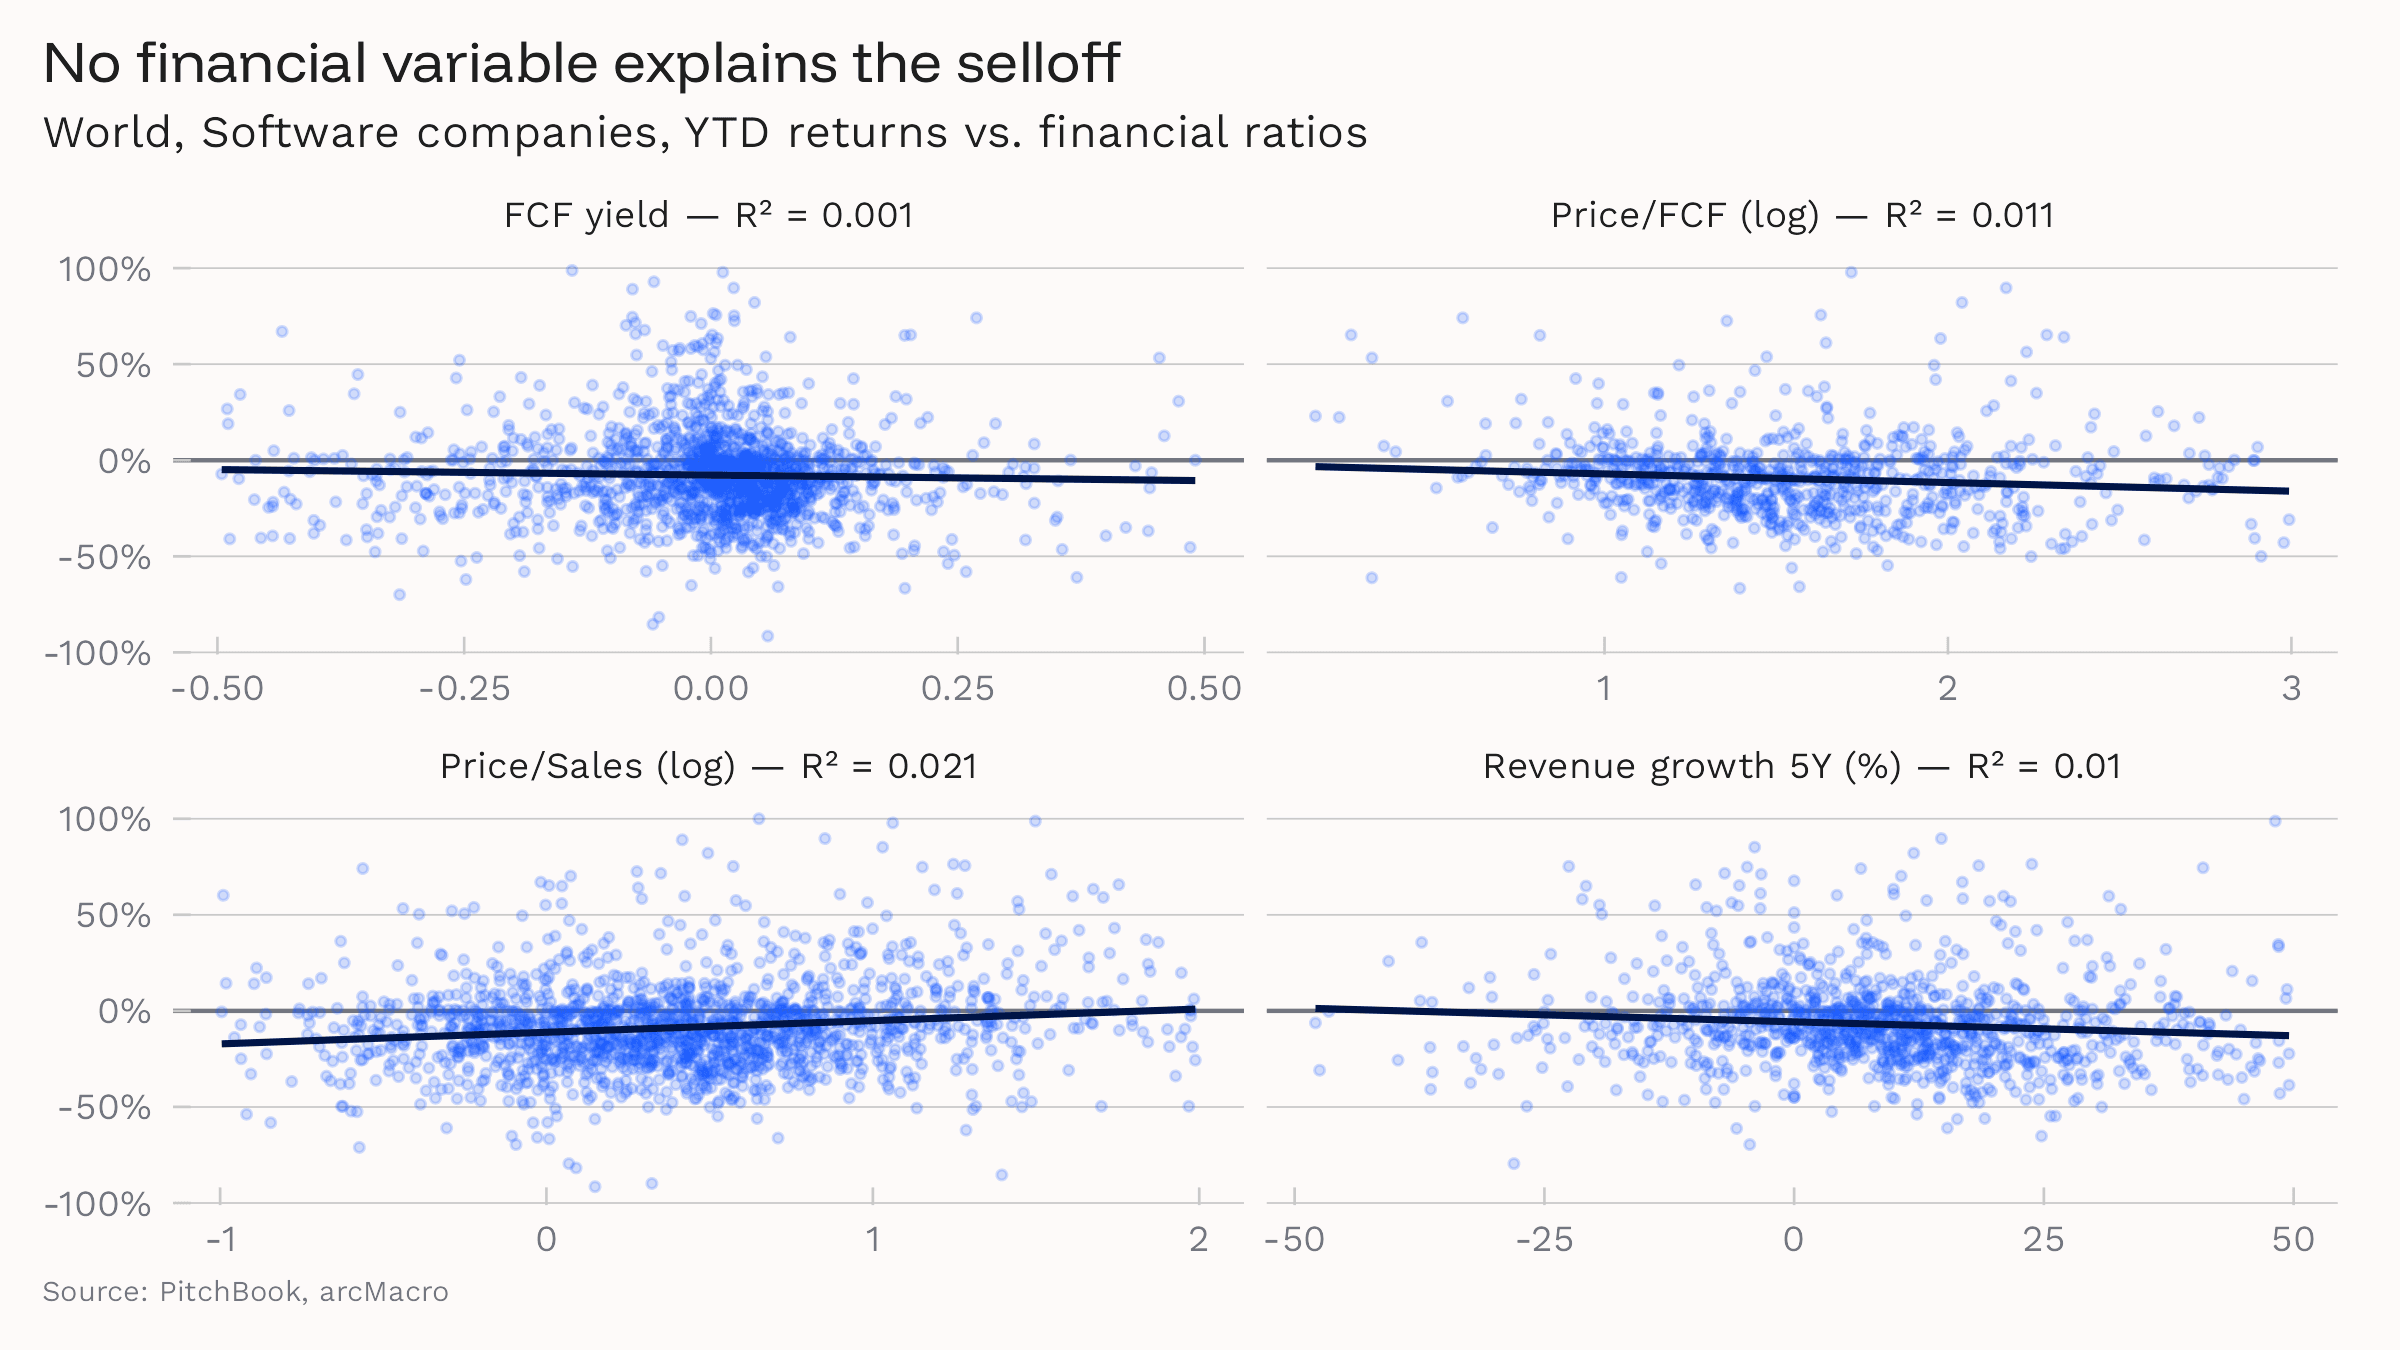
First, we looked at how performance differed across four financial ratios to see if recent performance played any role in which companies were assessed as more or less vulnerable. We studied free cash flow (FCF) yield (profitability — how much cash is the company generating relative to its size), price/FCF (valuation — how much are investors paying for a dollar of cash flow), Price/Sales (valuation — how much are investors paying for a dollar of revenue, whether profitable or not), and annualized 5-year revenue growth (growth — is this a high-growth player or mature incumbent?).
We found nothing. These financial characteristics of firms told us exactly nothing about which companies were being sold off. When we checked if it matters to be cashflow positive, we found that firms that are generating positive free cash flow actually got hit slightly harder, though the effect was very small.
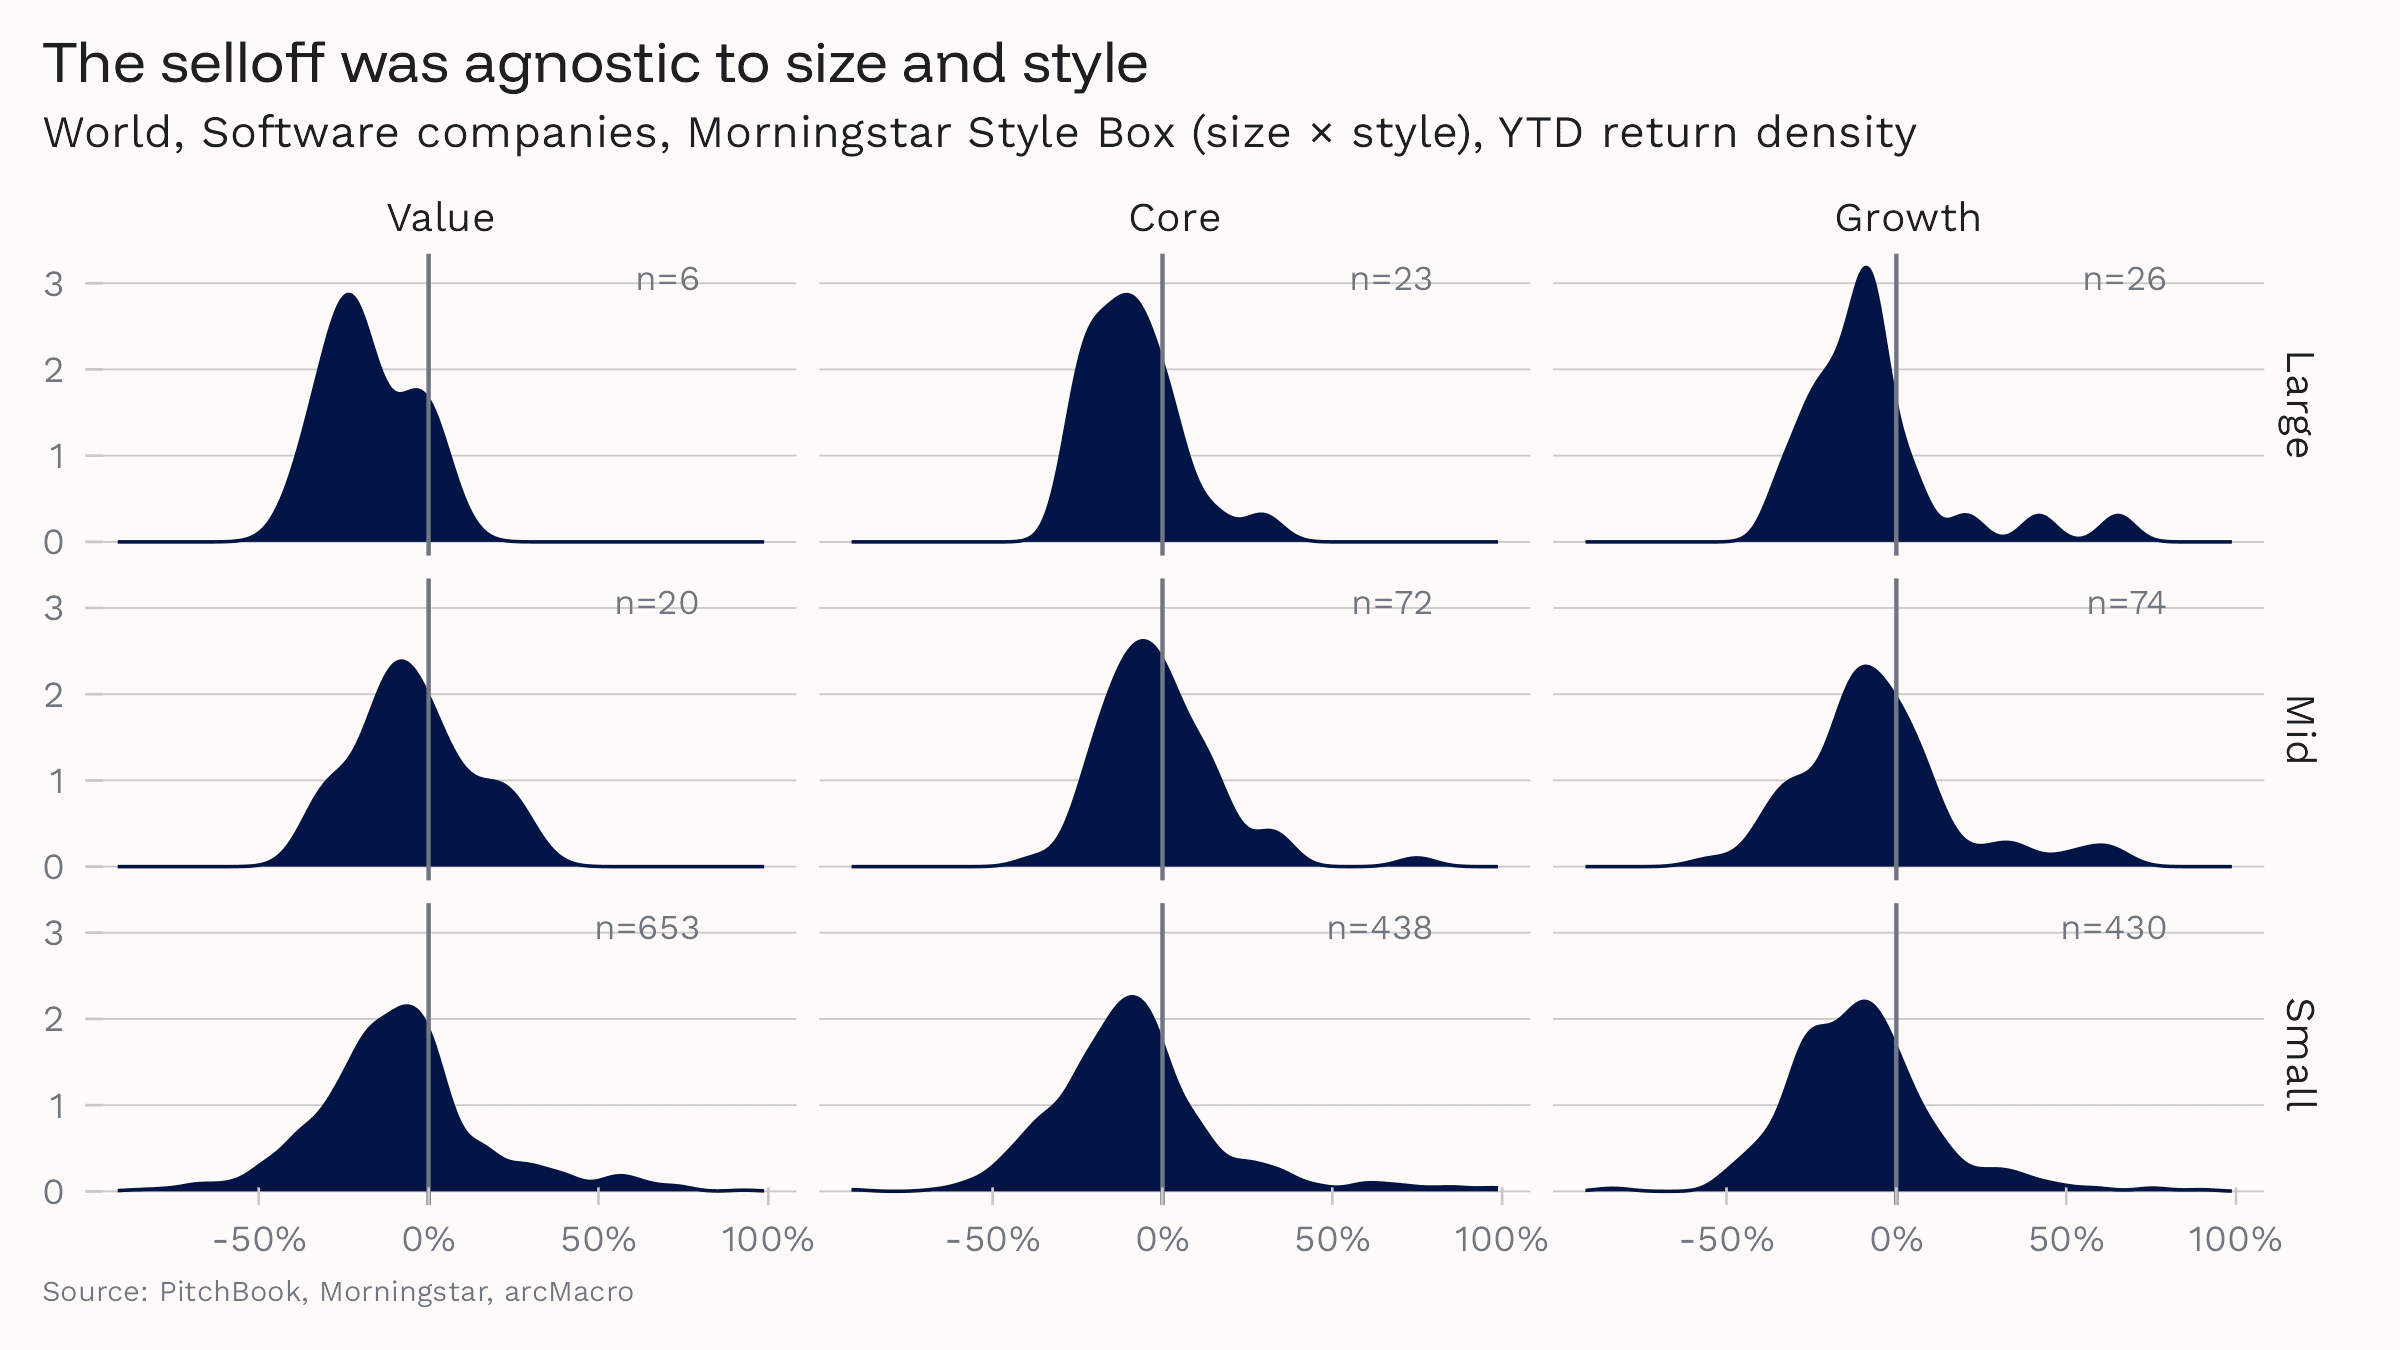
Next we tried a different approach to how company characteristics might affect their perceived vulnerability to AI exposure. We plotted the distribution of year-to-date returns for each of the 1,742 software companies that have a Morningstar Style Box categorization. We expected the distributions to look a little different depending on typical investment characteristics like size and style (growth, value, blend).
No luck. The density plots are very similar, with medians clustered tightly around -9.5% and a tight band of between 70% and 75% of the companies in each box having lost value this year.
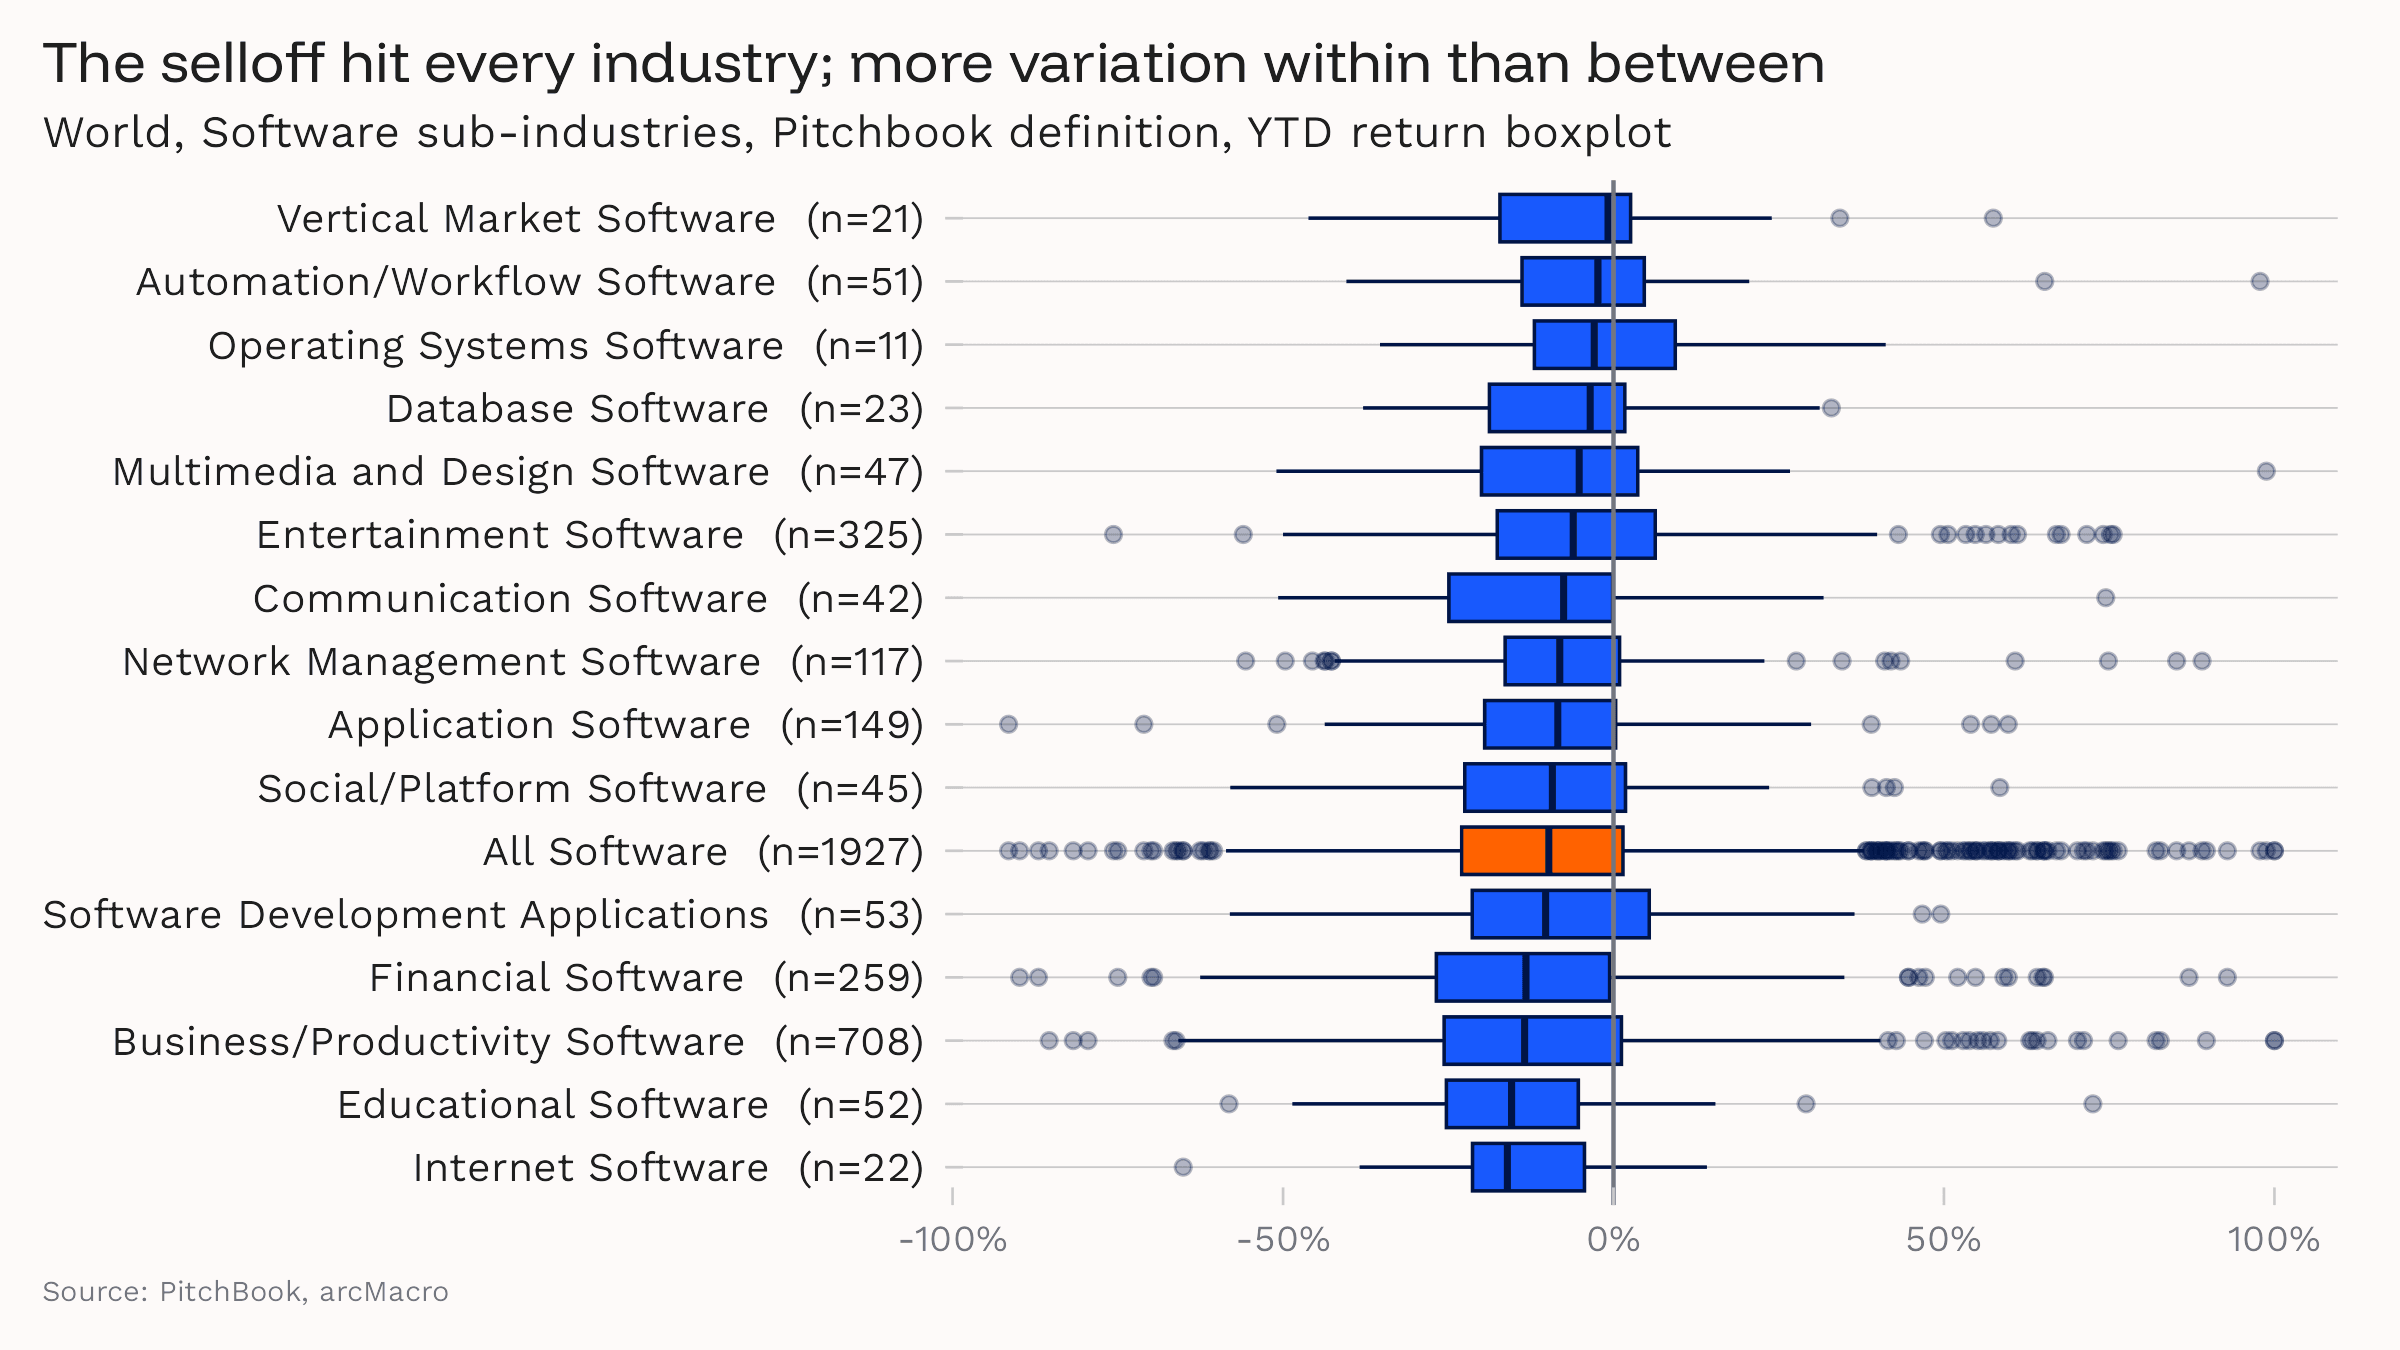
We had a strong prior expectation that some sub-industries within the broader software industry would be essentially unaffected by the selloff while others with more obvious AI exposure would house the majority of poorly performing stocks.
We were wrong.
Sure, the distributions of year-to-date returns are not identical, and it makes sense that the makers of vertical market software providers (e.g., Veeva Systems or Toast) or operating systems (e.g., Microsoft) might be less AI-exposed than other subindustries. But does it make sense that Internet software providers (e.g., Cloudflare) are more exposed on average than application software (e.g., Adobe)?
In fact, statistically speaking, the distributions also are not much different from what you would expect to see if there were no sub-industry differentiation at all. All the medians are negative, and the ones that look a little different from the overall software industry average have small samples. The ranges and skew are very similar. Critically, there is far more variation within each industry than there is between industries, telling us that the industry categorization is not a particularly informative metric.
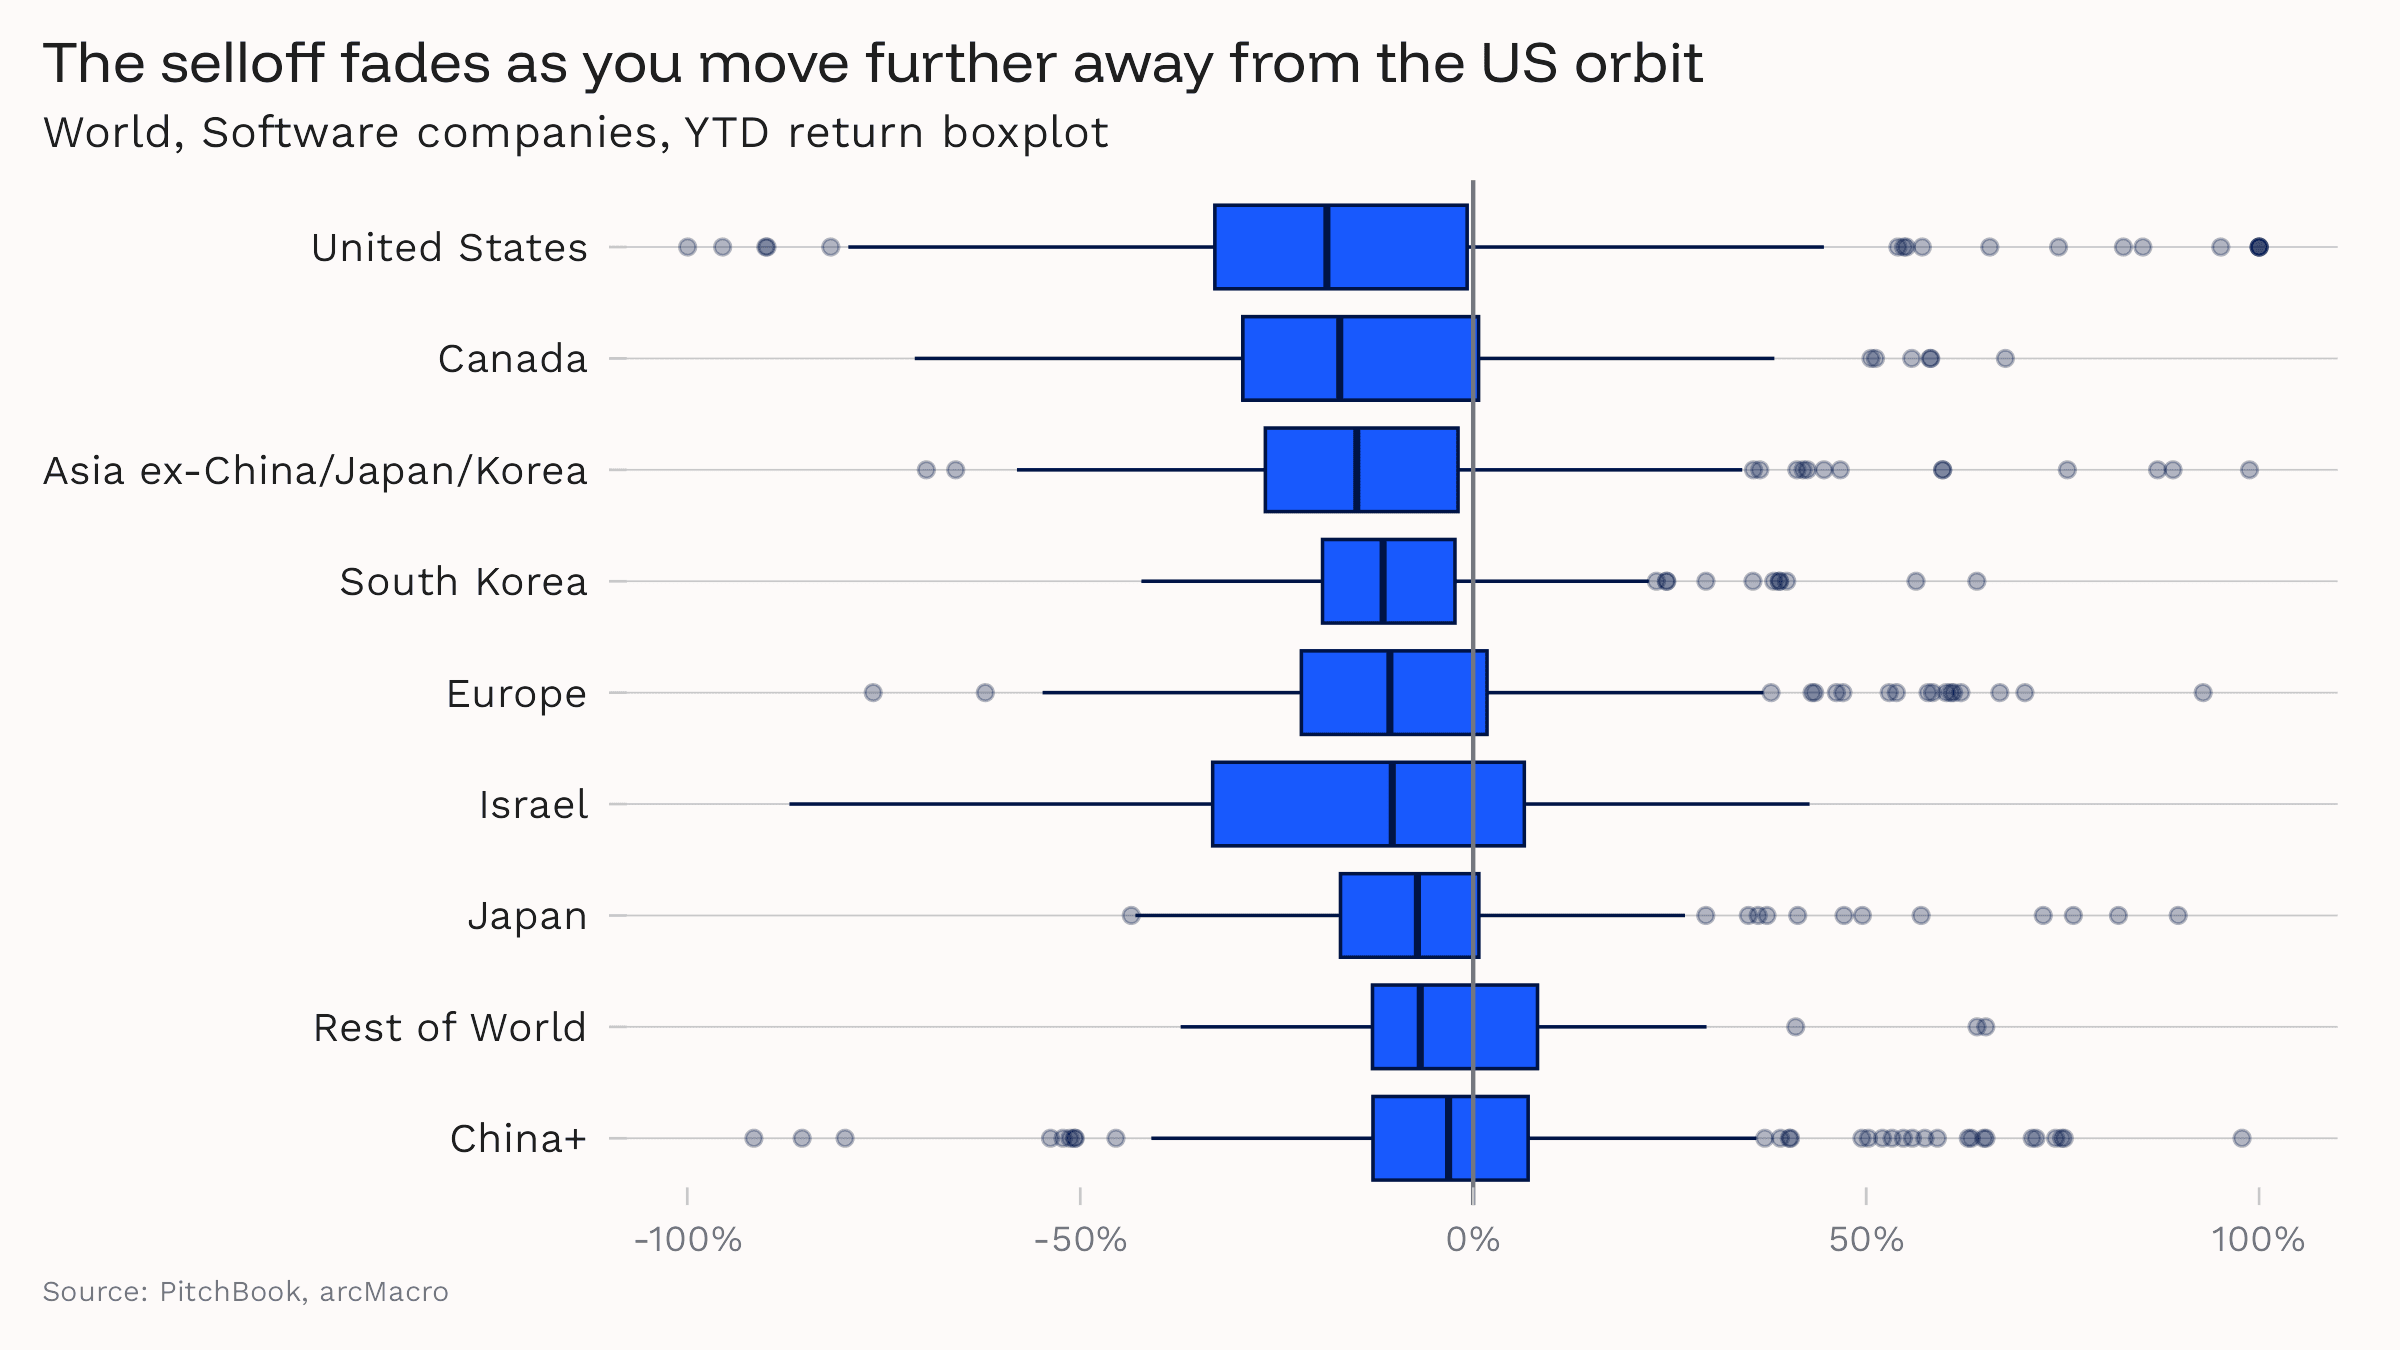
We finally had something of a hit when we split year-to-date performance by geography, where we found evidence that the software selloff is a primarily American phenomenon that spread only partially to the rest of the globe.
We categorized companies by their point of domicile. The exception was "China+" which includes Chinese companies listed in Cayman Islands, British Virgin Islands, and Bermuda. Asia ex-China/Japan/Korea includes Australia and New Zealand. Europe includes the UK.
As the chart below shows, the selloff has been most severe in US. Then, as you move away from integration with the US financial system, the selloff becomes less severe in terms of both median performance and the range of outcomes.
We validated this by looking at Chinese companies by their listing venue. Companies with US cross-listings have performed far worse than firms listed on the mainland.
As a last exercise, we narrowed in on the ~5% of the total software universe that carry a Morningstar "Moat" rating. Analysts score companies' ability to protect market share and exercise pricing power based on their intangible assets, switching costs, network effect, and cost advantage.
Here we got another partial result. The median company with a "wide" moat (i.e., who are able to withstand competition) has fallen by 9.5% (the same as the entire software universe), while those with narrow moats or no protection were down by more like 20%. This effect was driven by companies with strong network effects.
So, among the larger companies with coverage, a pre-existing moat helped, but these companies as a whole underperformed the broader global software industry anyway, so it's not much help.
Conclusion: Opportunity in the Stampede
Pulling the above results together, we would be within our rights to say that the archetype of the worst-hit company would be a mid-sized American internet software provider without a broad moat. But that's only on average, and this "most exposed" company would not have underperformed the rest of the group by much.
You could find plenty of large European or small Japanese software companies that were hit just as hard.
This was an indiscriminate, fear-based selloff.
How do we explain that finding? We see three broad possibilities, in order of importance.
- Investors can't sort positive AI exposure from negative AI exposure, never mind the degree of exposure. So they've dumped the sector while they assess and will selectively re-enter.
- The use of index funds, ETFs and broad sector strategies aggregated what should have been a company-level AI exposure shock into an industry-wide one.
- Traders genuinely think any and all software companies are about to be undermined by AI.
The first two options strike us as plausible, and they create some clear takeaways for investors.
First, the broad nature of the selloff and lack of selectiveness suggests the whole move is a bit overdone. There has not been a catalyst for a recovery, so the industry looks attractive on a relative valuation basis.
Second, software is now a stockpicker's dream.
Third, what are private equity and venture capital firms but long-term stock pickers? We see private markets as having important advantages over public in the software industry. They have a better understanding of how software business models intersect with AI, helping them select investments (are take privates in play at these valuations?) and improve their own portfolios. They're also able to look through short-term, sentiment-based volatility and bet on longer-term changes in the industry.
Appendix
Proprietary Factor and Regime Model and Key Indicators
Disclosures
AI Declaration
All written content, analysis, and opinions are original and ascribed to the author. AI tools were used for proofreading and summarization purposes only. AI tools may also have been used in the development (codebase) of the analytical models reported in this document.
Disclaimer
This publication is for informational and educational purposes only and does not constitute financial or investment advice. Nothing in this report should be construed as a recommendation to buy, sell, or hold any security or financial instrument. Always consult a qualified financial advisor before making investment decisions.